What’s new with Memory Validator
There are many changes coming to Memory Validator.
I’m going to describe the various changes and the reasons behind them.
Name Change
The first one is the name change. C++ Memory Validator becomes Memory Validator.
Because Memory Validator will be capable of handling multiple technologies and languages having language specific designators prefixing Memory Validator doesn’t make any sense.
New UX Theme
A new UX theme which is has less visual clutter and is calmer to look at has been introduced. We’ve written about that in New UX Theme.
.Net Support
Memory Validator now supports .Net languages. C#, VB.Net, C++.Net, etc.
.Net Memory Validator is discontinued, all of it’s functionality moving into Memory Validator.
x64 and x86 support
C++ Memory Validator shipped in two versions, a 32 bit version and a 64 bit version that could also process 32 bit executables.
Memory Validator ships in a 64 bit version that can also process 32 bit executables. On a 32 bit machine the 32 bit version installs, on a 64 bit machine both 64 bit and 32 bit versions install, because occasionally there is a 32 bit native bug that you only deal with from the 32 bit version of the tool.
The reasons for this change are
- .Net applications can be built in 32 bit, 64 bit, and Any CPU versions. An Any CPU version launched on a 64 bit machine will run as 64 bit. To provide full .Net support we couldn’t support Any CPU on 64 bit from 32 bit Memory Validator. The sensible option is to only support Memory Validator in a form that can support both 32 bit and 64 bit architectures.
- 64 processors are the dominant processors in the market. We should support these by default.
New menu items
To support the new .Net functionality there are some additional launch options for working with ASP.Net applications (IIS and Web Development Server) as well as .Net applications and .Net services.
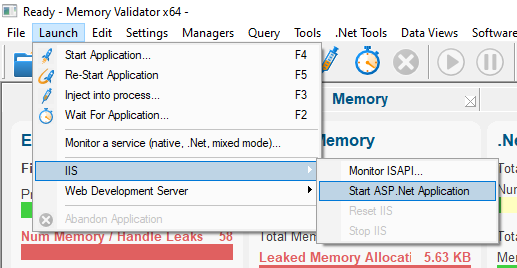
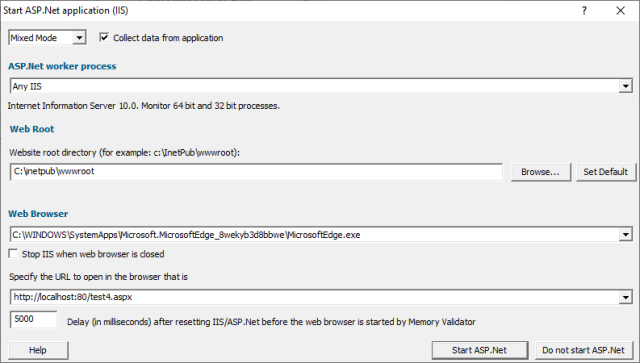
Launch ASP.Net application using IIS.
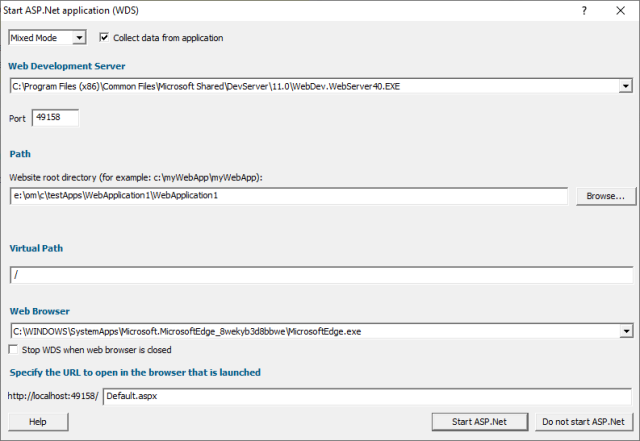
Launch ASP.Net application using Web Development Server.
New settings options
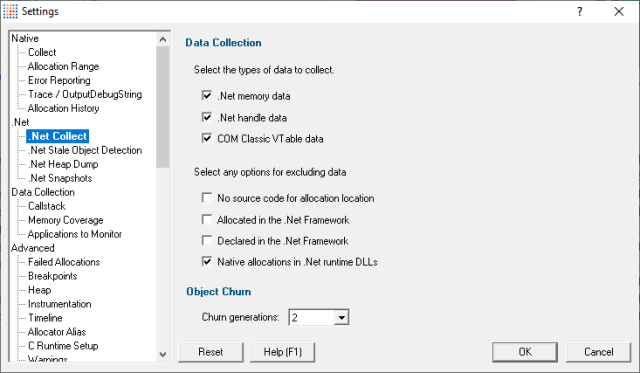
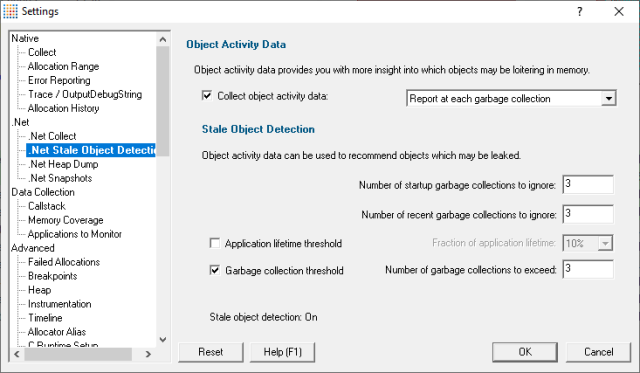
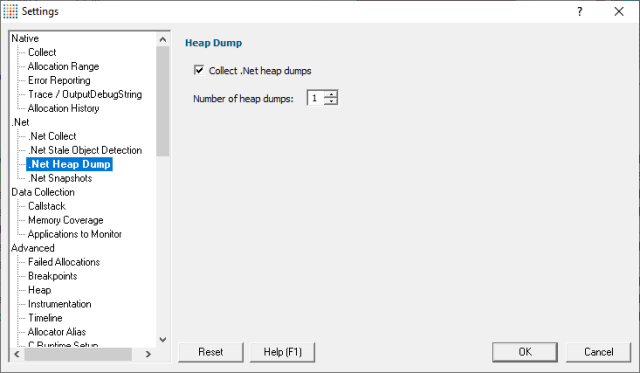
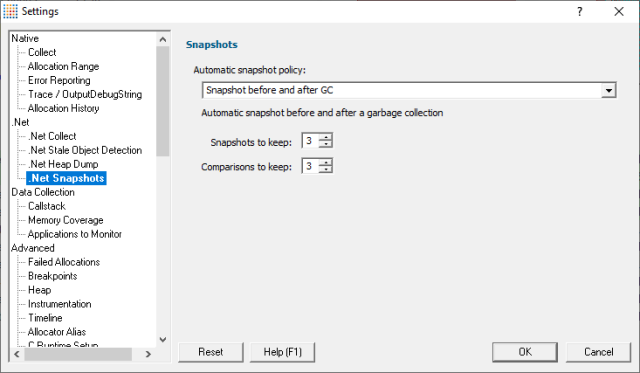
The settings dialog has four new panels to allow you to configure what types of .Net data are collected, whether to enable stale .Net object detection, if .Net heap dumps should be collected, and how and when .Net memory snapshots should be made.
.Net Collect
.Net Stale Object Detection
.Net Heap Dump
.Net Snapshots
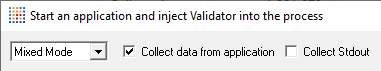
New launch option
With the ability to process both native and .Net applications and mixed mode applications comes the desire to sometimes restrict memory monitoring to just native code, or just .Net code, or to allow any code (mixed mode) to be monitored. To handle this we’ve added a simple combo dropdown on the various launch dialogs that allows you to choose how memory monitoring is handled at a very high level.
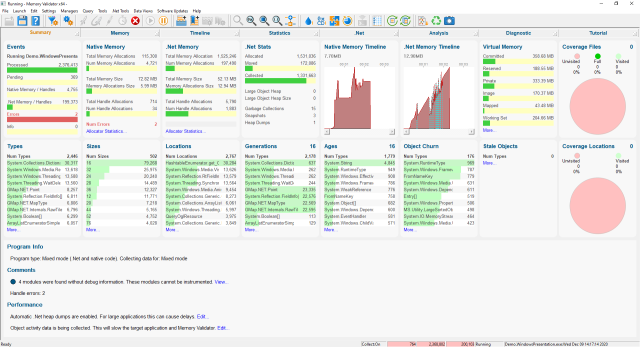
New Summary Display
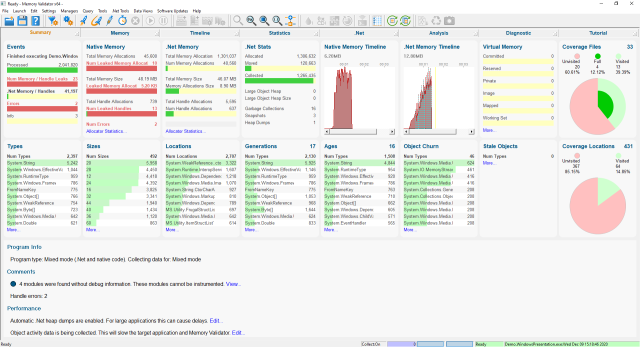
The summary display provides panels for a particular summary topic with key statistics for that topic displayed in the panel. Panels can display bar graphs, circular graphs and timeline graphs as well as data in table format. Most summaries allow you to click on a data item and be taken to a main tab for the data that was clicked on. This allows the summary display to function as a jumping off point to explore data throughout Memory Validator.
New Memory tab
The new memory tab performs the same function as the Memory tab in previous versions of Memory Validator, but now it contains two sub-tabs. One for viewing native allocations (memory and handles), and one for viewing .Net allocations (memory and handles).
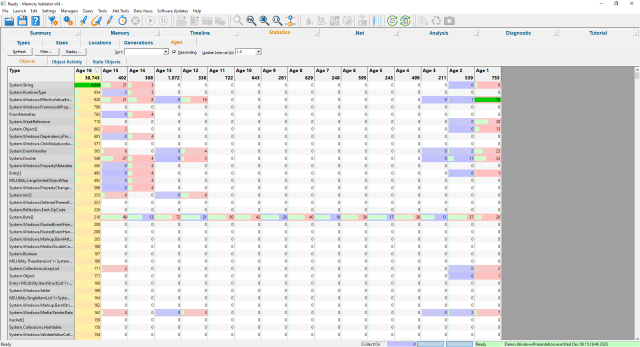
New Statistics tab
The Statistics tab is where all the main statistics data is grouped together. Previously this data was in 3 main tabs: Types, Sizes and Locations. Those 3 tabs are now sub-tabs under the statistics tabs. They are joined by two .Net specific tabs: Generations and Ages, which report information about which generation has how many objects and what ages given objects are. The Ages tab can also report information about stale objects if that functionality has been turned on (off by default as CPU intensive).
New .Net tab
A new .Net tab is where you can find 3 new sub-tabs dedicated to understanding .Net specific memory behaviour. The three sub-tabs are .Net Snapshots, .Net Heap Dumps and .Net Leak Analysis.
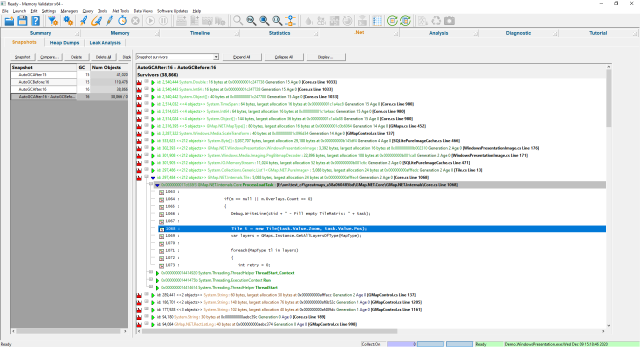
New Snapshots tab
The Snapshots tab allows you to take memory snapshots and compare them to other memory snapshots creating memory comparisons. Both snapshots and comparisons can be viewed to identify the location where an object was allocated. You can also use the context menu to then jump to that object in a heap dump reference graph.
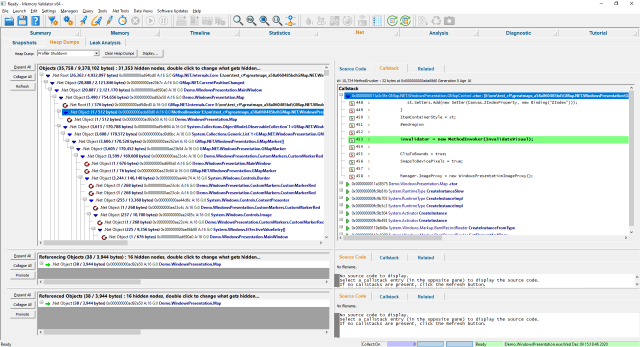
New Heap Dumps tab
The Heap Dump tab allows you to view heap dumps provided when a garbage collection takes place. Using the reference graph you can see which objects hold a reference to an object, and which objects an object is referencing. Plenty of options are provided to allow you to restrict the amount of data to wade through (so that you don’t end up with a graph full objects you didn’t build – from 3rd party software).
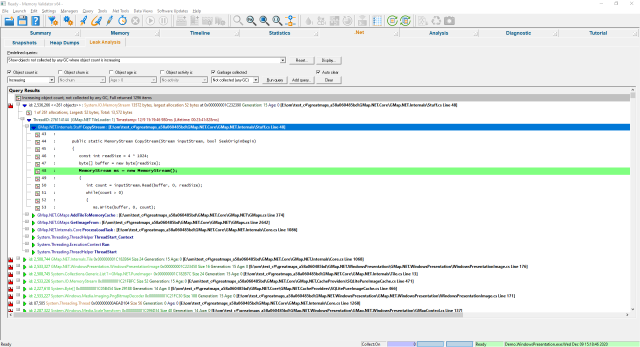
New .Net Leak Analysis tab
The Leak Analysis tab provides you with a powerful query functionality that allows to query the .Net allocation data to find objects that may be leaked, loitering unused in memory due to references that should have been set to null. We provide many predefined queries, but you can easily build your own queries. Combine with stale object detection data for even more power.
New Analysis tab
The old Analysis tab has been renamed Query and is now a sub-tab of the new Analysis tab. This sub-tab is joined by previous main tabs Coverage, Hotspots, Pages and Virtual.
The Hotspots tab has been updated to include hotspots for .Net memory and .Net handles. The hotspots tab has been moved to a sub-tab on the main Analysis tab.
Timeline updates
The Timeline tab has been updated to include data for .Net memory, .Net handles and .Net all allocations to provide an equivalent to the native timeline views.
Availability
These changes to Memory Validator will be available after 13 December 2020.