Large Scale Exception Tracing
We’ve just released another of our in-house tools – Exception Tracer.
Debugging Events
Exception Tracer started off life as an experiment and then through a series of needing to capture debugging data for various problems with customers, morphed into the exception tracing tool that it is today. Exception Tracer logs debugging events that are sent to debuggers. Most debuggers respond to these events in an interactive manner, breaking the code on exceptions (such as access violations and breakpoints), stepping into and out of functions, inspecting variables.
Exception Tracer doesn’t do any of those things.
Exception Tracer logs every event and stores callstacks associated with each event. You can save the entire trace and inspect it later. You can view the trace on a different machine than the machine it was collected on – send the trace to customer support for diagnosis.
Exceptions, DLLs and Minidumps
Exception Tracer is great for understanding what exceptions are thrown by applications that throw a lot of exceptions, whether that is by design, or because something is going wrong and the exception handling mechanism is being triggered a lot.
We’ve provided filtering so that you only collect the events you’re interested in – perhaps all you’re interested in is what DLLs load and unload and the order they load in, or maybe you only care about a custom exception that your program throws.
We’ve also provided the ability to create minidumps when exceptions are thrown – minidump for any exception, or just the exceptions you care about.
Single Stepping
Lastly, we’ve also provided automatic single stepping support (if you want it, turned off by default) with some intelligent options to reduce the amount of redundant single stepping events that are collected. Because you can turn single stepping on and off during a trace you can run at full speed to where the problem area is, turn on single stepping and collect just the area you need in detail.
We used single stepping to great effect to understand the cause of a stack overflow when one of our tools was shutting down on a customer machine. Turns out the culprit was an anti-virus product on the customer machine that was triggering an unexpected sequence of events that would never happen outside of the shutdown phase. We couldn’t get near this bug with a traditional debugger like Visual Studio, but Exception Tracer got us there (that’s where the intelligent filtering came in – the traces contained so many events we had to reduce the data size just to make it manageable when you were inspecting the results).
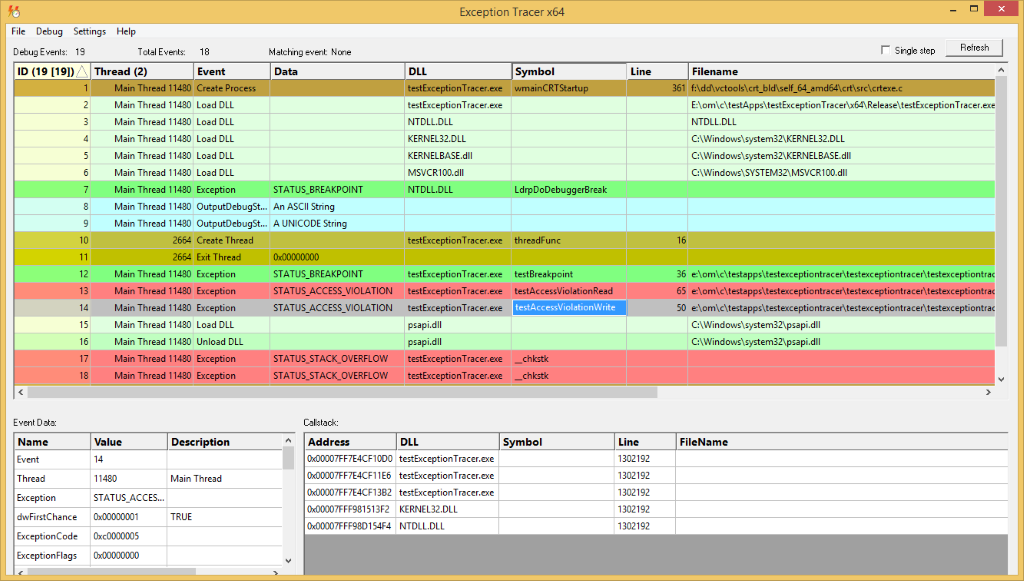
- Select an item in the top window to view the event data and callstack in the lower windows.
- Threads names are taken from GetThreadDescription() API (Windows 10), thread naming exceptions, and manual naming of threads (context menu).
- Specific threads can be highlighted so that you can pick out related events on the same thread.
We’d love to hear about problems you’ve solved using Exception Tracer. Please let us know.