New graphics in Performance Validator
We’ve just introduced some new visualisations of performance data into C++ Performance Validator and .Net Performance Validator.
The new visualisations make it much easier to understand what is happening – the relationship between child and parent functions and where you should be looking to make performance improvements to your code.
The past
First, lets look at what the existing visualisations were:
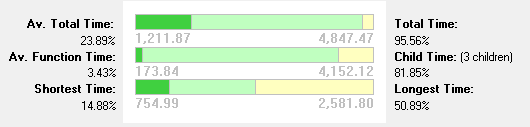
Functions:
Lines:
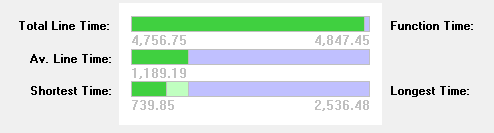
These are not awful, but they’re not brilliant – they don’t really help you understand what’s happening.
The new visualisations
We’ve replaced the above visualisations with some new visualisations that are easier to read, easier to understand and allow you make better conclusions as to where to focus in your code.
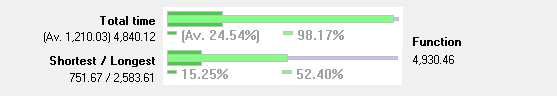
Functions:
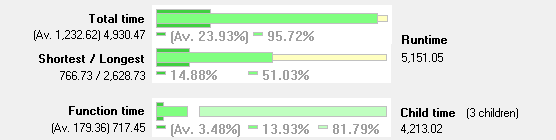
The top bar shows the function time and the average function time as fractions of the total runtime.
The middle bar shows the shortest function time and longest function time as fractions of the total runtime.
The bottom bar shows the function time, the average function and the child time as fractions of the total time for the function.
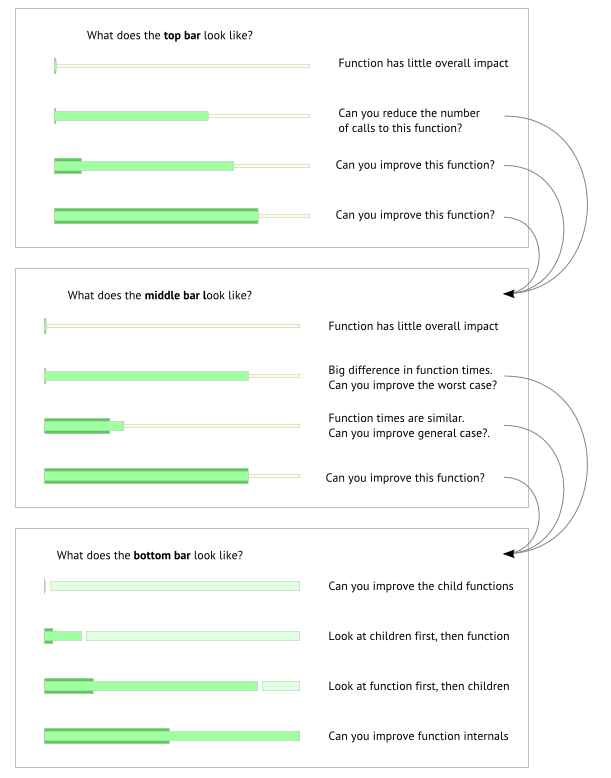
You can improve your code by looking at each performance bar and evaluating them as shown below.
Lines:
The top bar shows the line time and the average line time as fractions of the function time.
The bottom bar shows the shortest line time and longest lines time as fractions of the function time.
These allow you to identify the lines that are most dominant and also which have the greatest variability in execution time.
Conclusion
The new visualisations provide more insight into the performance data than the previous visualisations.
Credits
I’d like to mention the user experience consultancy Think UI for providing the design for these performance bars and for the very useful explanatory graphic that goes with them.